HISTORY OF U.S. BEAR & BULL MARKETS
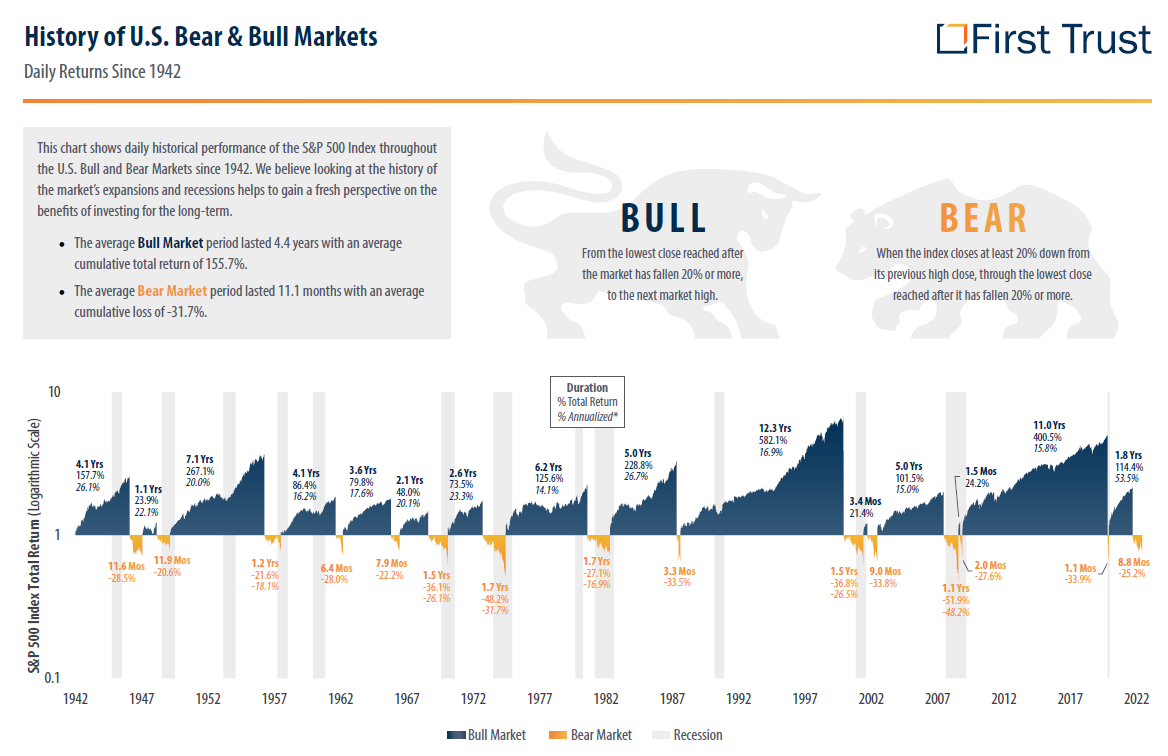
May 08, 2023This chart shows daily historical performance of the S&P 500 Index throughout the U.S. Bull and Bear Markets since 1942. We believe looking at the history of the market's expansion and recessions helps to gain a fresh perspective on the benefits of investing for the long-term.
This publication was originally posted by First Trust